
Learning Center
Learning
Welcome to the Boston Cell Standards Learning Center
From novices to experts, learn more about our solutions here.
What is cIHC?
What Is Calibrated Immunohistochemistry (cIHC)?
cIHC is traditional IHC with the added accuracy and precision of metrologic standards plus quantitative quality controls matched to the test. These quality assurance (QA) features are already a standard of laboratory practice in other laboratory medicine fields. It’s only new to the field of immunohistochemistry.
Metrologic standards
Metrologic standards, or “reference standards”, enable accurate measurement by defining units of measure for the analyte being measured. From reference standards, companies create and sell secondary standards, “calibrators”, to medical testing laboratories. For qualitative assays such as traditional IHC tests, calibrators can be used to determine the lower limit of detection (LOD), which is the threshold analyte concentration separating positive from negative.
All IHC tests have an LOD
It’s inherent in the test. With the advent of IHCalibrators®, it can now be measured. Cells expressing the analyte at concentrations below the LOD are unstained. The cells appear to lack the analyte, even if present at a concentration below the LOD. Problems arise when the LOD is too high, making the test insensitive. Aligning your laboratory’s test LODs with the target LODs will ensure accurate testing.
Boston Cell Standards’ calibrators have analyte concentrations traceable to NIST Standard Reference Material 1934, a universal IHC standard. Boston Cell Standards’ IHCalibrators® enable pathologists and laboratory directors to verify that the test LOD matches the desired LOD, ensuring clinical accuracy (“fit-for-purpose”).
Quantitative quality controls matched to the test. Boston Cell Standards’ IHControls® are:
Matched controls.
IHC controls with too high an analyte concentration will be a poor indicator of test problems. Homemade controls derived from pathologic discard samples are of unknown analyte concentration and will therefore be variable. A control should ideally have an analyte concentration within the dynamic range of the test. This can be determined by first identifying the analytic response curve of an IHC test, using IHCalibrators®. Then, select an IHControl® with a concentration that falls within the dynamic range. IHControls® are generally provided as “high”, “medium”, and “low”. Use of a control with too high an analyte concentration will prevent the detection of test problems that can affect patient samples with lower analyte concentrations.*
Quantitative, for exact QC monitoring
Boston Cell Standards’ IHControls® are extremely homogeneous and reproducible, enabling Levey-Jennings graphical analysis.
*K Vani, SR Sompuram, AK Schaedle, A Balasubramanian, M Pilichowska, S Naber, JD Goldsmith, KG Chang, F Noubary, & SA Bogen. The importance of epitope density in selecting a sensitive positive IHC control. J. Histochem. Cytochem. 2017 65(8):463-477.
cIHC Terminology
Calibrated IHC (cIHC) introduces terminology that is well-established in the field of laboratory medicine but new to immunohistochemistry. For the sake of clarity, we define the terms.
“Analyte” is the molecule that is being measured or detected. For example, in a TTF-1 stain, the analyte is TTF-1.
“Analytic response curve” is a graphical representation of stain intensity (y axis) as a function of analyte concentration. The analytic response curve will show both the dynamic range and a plateau, where increasing analyte concentrations yield little or no further increase in stain intensity.
“Analytic sensitivity” refers to the ability of an IHC test to detect a defined number of analyte molecules. More sensitive tests will detect cells expressing a lower number of analyte molecules. Analytic sensitivity is often defined through the lower limit of detection (LOD) and dynamic range.
“Calibrator” is a sample that has a defined analyte concentration through a measurement that is usually traceable to a reference standard.
“Control” is a sample that either has an expected test result (as provided by the manufacturer) or the laboratory establishes the expected test result by repeat testing.
“Dynamic range” is the analyte concentration span from the lower limit of detection (LOD) to the concentration that produces maximal staining. The dynamic range of an IHC assay is typically narrower than the biologic range of protein expression.
“Levey-Jennings graph” is a graph for tracking quality control (QC) data over time. Typically, the graph shows QC test results or stain intensity (y axis) for each day (x axis). It’s a data analysis tool that helps identify subtle shifts or trends in assay performance that might otherwise be missed. This may serve as an early warning of a developing problem.
“Lower limit of detection (LOD)” is the lowest analyte concentration that visibly stains. Lower LODs indicate greater analytic sensitivity, in being able to detect fewer analyte molecules. LOD is important because it is the threshold of cellular staining, directly affecting a pathologist’s readout.
“NIST” – National Institute of Standards and Technology
“Reference standard” is a sample whose concentration is considered the most accurate and therefore defines the applicable unit of measure. Reference standards are used by companies in preparing secondary standards, “calibrators”, for commercial distribution.
Calibrators and Controls
| Feature | IHCalibrators® | IHControls® |
|---|---|---|
| Appearance | A microscope slide with 15 calibrators | Vial containing a liquid suspension |
| Analyte concentration | Exact concentrations for each level, traceable to NIST SRM 1934 | High/intermediate/low |
| Formalin-fixation | No; formalin-fixation would break the traceability to NIST SRM 1934 | Yes; since concentrations are not intended to be exact, IHControls® can serve as a test of antigen retrieval |
| Purpose | Measurement of analytic sensitivity (LOD and dynamic range) | On-slide verification that test performance is the same as previous days |
| Number of times it can be used | 1/slide | 100/vial |
| How to use it | Stain it as if it had a patient sample | Pipette it adjacent to patient sample, then stain slide as normal |
| When to use it | Initial assay validation Periodically (e.g, monthly) New reagent lots to test for lot-to-lot consistency During a problem investigation |
On every patient slide (on-slide control) |
| Storage | Refrigerator | Refrigerator |
What IHCalibrators® and IHControls® are made of
IHCalibrators® and IHControls® are made of 7-8 micron diameter glass microbeads coated with the analyte, either as a peptide or whole protein. The microbeads are suspended within a proprietary liquid matrix that solidifies into a firm gel after dispensing onto a microscope slide. The solidified matrix is porous to IHC staining reagents, allowing antibodies and other reagents that are applied during the IHC staining procedure to diffuse in and stain the microbeads in a similar fashion as they stain tissue sections. IHCalibrators® and IHControls® can be baked, deparaffinized, antigen-retrieved, and stained just like tissue sections. Since the analyte is on the microbead surface, staining will preferentially appear on the periphery, like membranous staining of a cell. Localization of the staining on IHControls® and IHCalibrators® is irrelevant to the information that these tools provide.
Each product includes a positive and negative specificity control as well as an optical color intensity standard for objective, reproducible stain intensity quantification. This optical color intensity standard is a smaller microbead that is approximately 3.5 micron diameter. Unlike the clear glass test microbeads, the optical color intensity standard microbeads are permanently colored brown. They serve to standardize stain color intensity measurements, normalizing for differences in the optics and illumination.
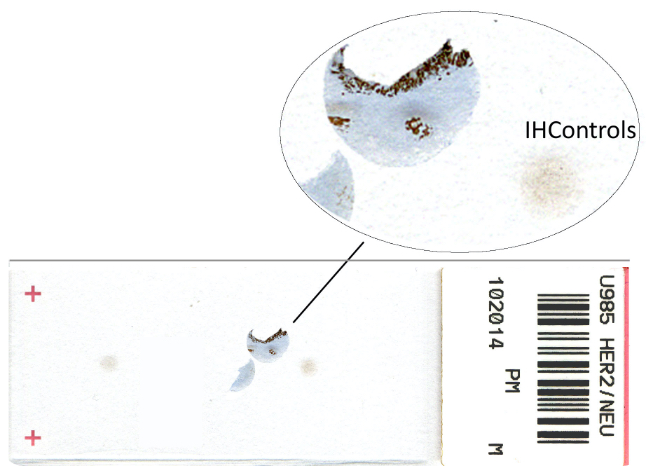
Figure 1: A microscope slide bearing a tissue sample and an adjacent IHControl® spot.
 Figure 2: Stained IHControl® after staining showing three types of microbeads. The stained 7 – 8-micron diameter microbeads (“positive control”) bear the analyte. The unstained microbeads (“negative control”) bear an irrelevant analyte. The smaller 3.5-micron color standard microbeads are permanently colored dark brown. Scale, 10 microns.
Both figures are from SR Sompuram et al. Standardizing immunohistochemistry: A new reference control for detecting staining problems. J Histochem Cytochem 2015 63:681-690.
How to read IHCalibrators®
 Set up the microscope with Köhler illumination. Once you do, then open the condenser aperture all the way. This minimizes refraction, making it easier to judge staining of the test microbeads. Like the examination of tissue samples, start with a 10X objective magnification and then transition to a 40X for a clearer evaluation. Also, start with the calibrators having the highest concentration, level 10, because they usually stain strongly and can easily be seen, even with a 10X objective lens. You can find the slide layout, identifying the locations of the various levels and negative controls, on the accompanying Certificate of Analysis. The slide itself also has numbers that identify the levels.
Once you see strong staining around the microbead periphery at level 10, verifying that you’re in the right focal plane, then observe the negative control. If you look closely, using a 40x objective lens, you may notice an extremely slight stain. This is normal. It’s analogous to the background absorbance in an ELISA. The matrix in which the microbeads are suspended can also slightly pick up the stain. By noting the stain intensity at level 10 and the negative control, you’ve defined the maximum and minimum boundaries of stain intensity.
Go back to level 10 and start working down the calibrator series. As you move to levels 9, 8, and lower, you will eventually observe the microbead stain intensity fading. Continue inspecting lower levels until you find a calibrator level that has weak but detectable staining above the background level. For these lower levels, with a weak stain intensity, the 40X objective lens will be needed.
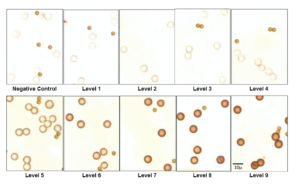
The accompanying figure illustrates a series of calibrator levels, from levels 9 to 1 and a negative control. Level 10 was not included because, in this series, it was the same intensity as level 9 and did not add anything. The calibrators in the illustration have the same very slight background from levels 1 – 4 and the negative control. Level 5 is the first step up in stain intensity, above that background. Level 5 is the lower limit of detection (LOD).
Then, check the Certificate of Analysis to find out the analyte concentration associated with this level. That’s your lower limit of detection or “LOD”, or at least close to it. It’s the threshold concentration in your laboratory that causes cells to stain for this particular test. The LOD may be slightly lower than the visually identified one, but that can only be calculated using image quantification. The LOD will vary, depending on the test, but any single test should have a consistent LOD over time. Moreover, the LOD should be consistent among instruments, if you perform the same test on more than one instrument. If your LOD is higher than the LOD of other labs using the same test, then there may be cases that are positive in their test but negative in yours. The number of discrepant cases will depend on how far away your LOD is from the peer consensus. That’s all there is to it. Now, you know how easy it is to read and find the LOD for your test.
How to use IHCalibrators®
The purpose of calibrators in immunohistochemistry is the same as for all other laboratory testing fields, such as clinical chemistry. Calibrators provide objective verification of analytic sensitivity, ensuring alignment of your test’s performance with other IHC laboratories. Calibrators are useful in the following circumstances:
During initial assay validation
By confirming that your lab’s limit of detection (LOD) is the same as your peer group, you verify that the test is likely operating correctly. Verifying test performance with calibrators is standard of practice for clinical laboratory immunoassays. It is also useful for confirming test equivalence when multiple instruments are used in a lab for the same stain.
Periodically (e.g., monthly)
The frequency for periodically re-verifying depends on the performance stability of the entire analytic system – instrument and reagents. Testing with calibrators verifies that the final end result is accurate.
For verification of new reagent lots
Calibrators are the most sensitive method for verifying new reagent lots because the entire range of analyte concentrations is represented. Testing with tissue samples that are strong positives (i.e., that have high analyte concentrations) can provide a false reassurance, failing to detect a shift even when changes occur.
During a problem investigation
Calibrators are the most sensitive investigative tool for verifying test performance because they evaluate the test across a broad range of known analyte concentrations. Calibrators speak to whether a problem exists, its magnitude, and whether it was successfully fixed after intervention.
Testing primary antibody dilutions
In titering out a primary antibody, you’re seeking the highest dilution (lowest concentration) that yields the lowest LOD. Greater sensitivity is associated with lower LODs. More concentrated antibody (lower dilutions) beyond the optimal will not change the LOD but risk non-specific staining.
Examples of cIHC use
Example 1: Faulty IHC stain detected with IHCalibrators®1
During a routine proficiency survey for estrogen receptor (ER), Laboratory “B” passed. However, analysis using IHCalibrators® revealed that its LOD (74,790 ER molecules per cell equivalent) was much higher than peer labs. A high LOD means that more ER per cell is required in order to generate a visible stain. Careful analysis showed that several tissue cores in the proficiency test survey did not stain even though they should have. Figure 1 shows IHC staining of six breast carcinomas illustrating the vastly different range of stain intensities, and therefore LODs, for Labs A and B. Included are cases that appear to have comparatively strong (cases 1 and 2), intermediate (cases 3 and 4), and weak (cases 5 and 6) ER expression.
Strikingly different ER stain results from two labs with different LODs. IHC staining of six breast carcinomas illustrating the range of stain intensities for Labs A and B. Included are cases that appear to have comparatively strong (cases 1 and 2), intermediate (cases 3 and 4), and weak (cases 5 and 6) ER expression.

Figure 1: Stain intensity variation between different labs.
An IHC laboratory at a large academic medical center used 5 identical IHC instruments and suspected that stained slides from one instrument sometimes appeared overly weak. The instrument vendor inspected the 5 instruments and stated that they were all working properly. The lab staff ran IHCalibrators® on each of the 5 instruments (Figure 2). One instrument was different. The Medical Director confirmed these data by performing quantitative image analysis using tissue sections. Faced with this quantitative data, the vendor replaced the instrument. After replacement, the lab confirmed that the problem was solved using calibrators. The new instrument’s analytic response curve was now identical to the others. Figure 2 shows the dynamic range of the same PD-L1 test on several identical instruments. The instrument in red was repeatedly different.
 Figure 2: PD-L1 test variation.
Example 3: Inconsistent staining3
At a collaborating laboratory, the regular IHC histotechnologist went on vacation. Quantitative tracking using IHControls® showed a sudden decline in stain intensity that reversed upon return of the regular IHC histotechnologist. This is illustrated in Figure 3, showing a Levey-Jennings graph of stain intensity over time. Investigation revealed that the covering histotechnologist adjusted the instrument to dispense less primary antibody, hoping to save on primary antibody. It was not realized that this substantially changed the test’s performance characteristics.
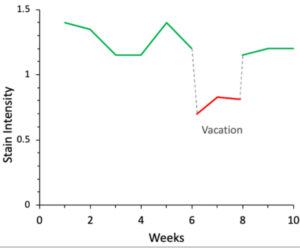 Figure 3: Level-Jennings graph of PR staining.
Example 4: Determining the optimal antibody dilution for a new reagent lot
With an antibody concentrate, manufacturers’ recommended dilutions are not always optimal for a given lab’s IHC conditions. Therefore, IHC laboratory staff must independently identify the optimal dilution. However, it’s more complicated than many realize. When figuring out the antibody dilution, analyte concentration is an important variable. Antibody dilutions that may look great with high analyte concentrations can stain poorly – or not at all – with low analyte concentrations.
The importance of testing the full range of analyte concentrations is illustrated in the accompanying figure. Optimal dilution is determined as the lowest antibody concentration that yields maximum stain intensity. This particular test is for the SP1 estrogen receptor antibody. The optimal antibody dilution (y axis) depends on the analyte concentration that is tested (x axis). With tissue sections, analyte concentrations are unknown. With an IHCalibrator™, you can test the full range of concentrations, all at once, ensuring a dilution with maximal sensitivity and minimum background.
 Figure 4: Primary antibody dilution depends on analyte concentration.
1 EE Torlakovic, et al. Development And Validation Of Measurement Traceability For In Situ Immunoassays. Clin. Chem. 2021. DOI: 10.1093/clinchem/hvab008, in press.
2 Manuscript in preparation
3 K Vani, et al. Levey-Jennings analysis uncovers unsuspected causes of immunohistochemistry stain variability. Appl. Immunohistochem. Mol. Morphol. 2016 24(10):688-694.
How to select a matched IHControl®
Select a control with the lowest analyte concentration that produces a readily visible stain. Controls with an excessively high analyte concentration will remain positive even when there are IHC test problems.
Boston Cell Standards generally provides IHControls® at up to 3 analyte concentrations: high, intermediate, and low. The corresponding concentrations are not calculated and vary depending on the analyte. As a general rule of thumb, after using an IHCalibrator™ for your assay, if your LOD is in levels 2-4, a low IHControl® is best; 5-7, intermediate; 8-10, high.
Why cIHC is needed
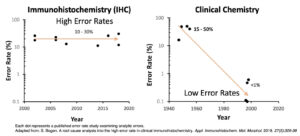
Calibrated IHC is based on clinical laboratory practices as found in virtually every other type of clinical laboratory. Boston Cell Standards now provides the tools to extend those highly beneficial practices to the IHC laboratory. During the last half century, the field of laboratory medicine has broadly adopted clinical laboratory practices incorporating metrologic standards, measurement traceability, and quantitative quality control. For immunohistochemistry, it wasn’t technically possible until now. As a result, inter-laboratory test variability is at least ten times higher in IHC than compared to other types of clinical laboratories. The figure shows the rate of inter-laboratory discrepancies based on published studies, in the fields of both IHC and clinical chemistry. Test discrepancies were determined from surveys where the exact same specimens were analyzed by many laboratories. Boston Cell Standards wants the rate to decline to <1%, as it already has in other clinical laboratory disciplines.
The importance of measurement traceability
How do you know that your IHC lab is reporting accurate test results?
“We pass proficiency tests” is a common answer.
The problem with that answer is that the samples in proficiency tests are random. Some will have high analyte concentrations, which everyone will get right. Samples with low analyte concentrations are often missed. Passing a proficiency test survey typically requires 80% or 90% correct answers, which means that a lab could miss the low-positive samples and still pass. Even still, proficiency testing programs routinely report that 10 – 30% of the participants are borderline or failing.
Harmonizing test results of different laboratories requires that each lab demonstrate an accurate result using samples with analyte concentrations at diagnostically important concentration thresholds. Right now, we cannot measure analyte concentrations in cells within a tissue section. This is the problem that measurement traceability solves.
Measurement traceability refers to performing measurements so that the test result can be related to a reference standard through a documented, unbroken chain of calibrations. It’s a time-tested system to ensure accuracy and reproducibility. It is important even for qualitative tests, such as exist for IHC.
Boston Cell Standards is the first to adapt measurement traceability for immunohistochemistry. The company’s products are made of purified analyte, typically as either a peptide or protein, attached to cell-sized clear microbeads. The microbeads serve as a solid support, analogously to a microtiter well in an ELISA. Measuring the concentration of the analyte (on the microbead) can be accomplished by detecting the analyte and comparing it to known concentrations of a reference standard. However, there are no IHC reference standards. Therefore, we need something else to compare it to.
To solve the problem, Boston Cell Standards attaches a fluorescein to every analyte before coupling it to the cell-sized microbead. This is illustrated in the figure. Although there are no IHC reference standards, there is a fluorescein reference standard – NIST Standard Reference Material (SRM) 1934. It is used for flow cytometry, in conjunction with flow cytometry microbeads. By measuring the fluorescence on the microbeads, we can then calculate the analyte concentration by comparing it to the fluorescence of the reference standard. With NIST’s help, there is an unbroken chain of calibrations linking the analyte’s fluorescein concentration to the concentration of NIST SRM 1934. Boston Cell Standards offers NIST SRM 1934-traceable calibrators for many different IHC analytes. These calibrators come in a broad range of concentrations, from approximately 10,000 – 1,000,000 molecules per microbead.
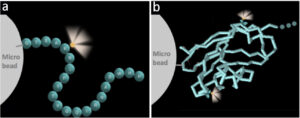
Figure: Schematic illustration of calibrator construction, with the analytes having attached fluorescein(s). The fluoresceins are shown as glowing yellow spheres that provide a link for traceability of concentration. The analyte is represented either by a peptide (a) or a protein (b), covalently coupled to a microbead. Figure from SR Sompuram et al. Standardizing immunohistochemistry: A new reference control for detecting staining problems. J Histochem Cytochem 2015 63:681-690.
