Physical Characteristics
BCS IHCalibrators, which enable IHC Calibration, are described below. (Figure 1)
- 15 small round spots pre-printed on a microscope slide.
- The spots are glass microbeads covalently coated with a biomarker.
- Each bead has a defined concentration of biomarker traceable to a primary NIST standard.
- The numbers provide an orientation to the sequence of increasing biomarker concentrations.
- A certificate of analysis provides the exact concentration for each level.
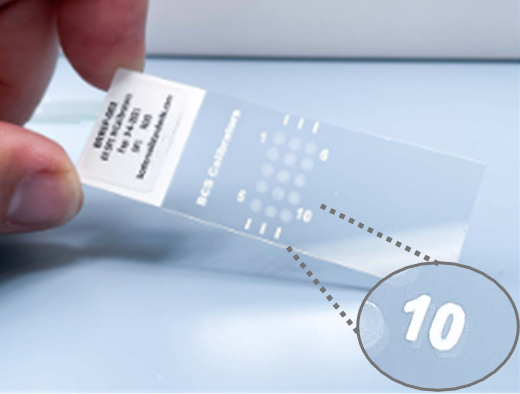
Figure 1. IHCalibrators
Schematic Representation and Photomicrographs
Figure 2 below provides a schematic representation of Calibrator levels 1-10 (Panel A) and photomicrographs of the stained microbeads (Panel B). The actual LOD is likely at a concentration between levels 4 and 5.
- Identify the lowest concentration level that is still stained.
- In these examples, level 5 is the lowest that still has sufficient color intensity to consider positive.
- Look at the Certificate of Analysis for the calibrator and correlate it with the actual concentration.
- The actual Lower Limit of Detection (LOD) is likely at a concentration between levels 4 and 5.
- Metric calculates the precise LOD.
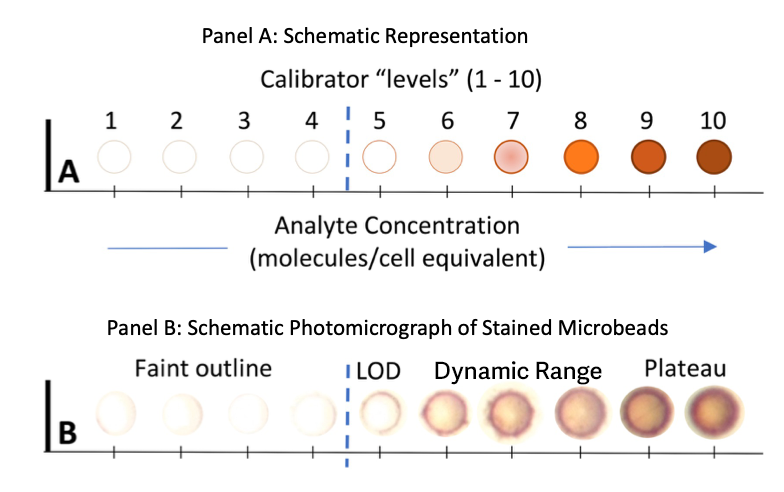
Figure 2. Schematic Representations of Calibrator Levels and Photomicrographs