Once you have uploaded Calibrator slide images to Metric, the IHCalculations software automatically:
- Analyzes the images and quantifies the stain intensity of the images.
- Produces a Metric Calibration Report.
Figure 4 below provides an example of a Metric Calibration Report. We have provided annotations (Text box and A, B, and C below) to explain the blue dots, the red fitted analytic response curve, and the calculation of LOD, which in this case is is 6960 molecules/cell equivalent.
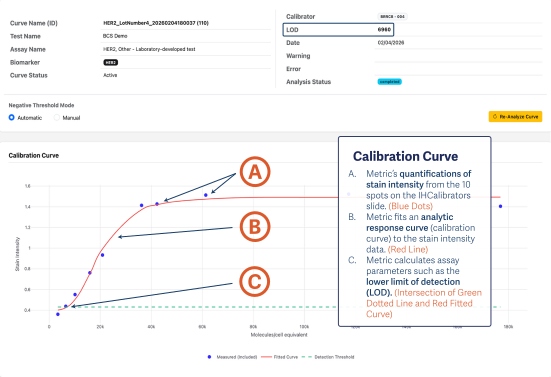
Figure 4