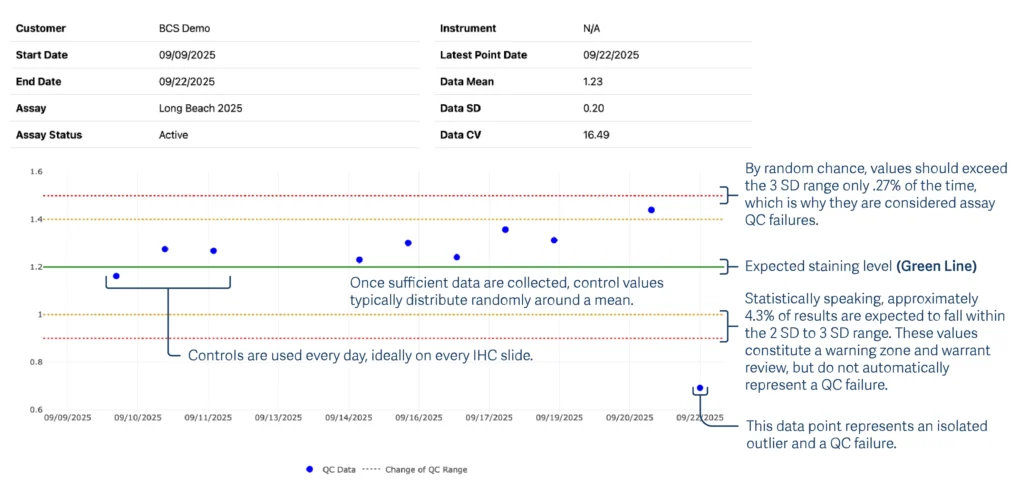
Figure 5. Metric Levey-Jennings Graph With Explanations
A Levey-Jennings Graph tracks quality control results over time against your expected mean and ranges for QC data acceptability. If your control results fall outside these pre-defined ranges, it typically requires a prompt evaluation to determine whether the IHC assay was valid.
Key Clinical & Regulatory Considerations:
- Direction of Errors: Most out-of-range events in IHC will be aberrantly low, indicating a loss of assay sensitivity. When this happens, the lab must resolve the issue and determine if patient sample staining might be affected.
- Regulatory Documentation: Documentation of an out-of-range event and its subsequent resolution is typically required by regulatory authorities. (Note: You can use Metric’s “Edit” button on the QC Data table to add resolution comments and maintain your audit records).
- Westgard Rules: Further information about Levey-Jennings graphs and the application of Westgard rules can be found in numerous Journal review articles, textbooks, and the Westgard website: https://www.westgard.com/
When reviewing your Levey-Jennings graphs in Metric, you are generally looking for three categories of quantitative errors. Recognizing these patterns offers clues as to the root cause of an assay issue.
Common Levey-Jennings Graph Patterns
Pattern 1: Drift
Drift appears as a consistent trend on the graph that develops slowly over days or weeks, often only coming to your attention when it finally crosses the 2 SD or 3 SD limits. Something is changing slowly in the instrument or reagents. See Figure 6 below.
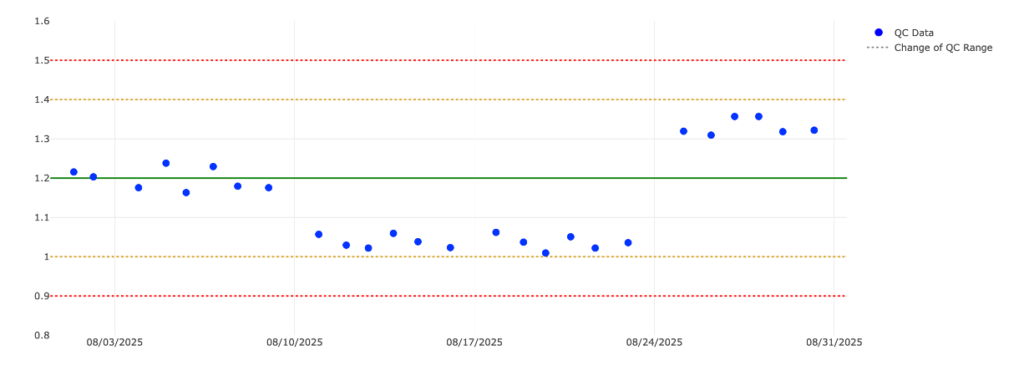
Figure 6. SPC Error – Drift Pattern
Possible Causes:
- Slow reagent degradation (approaching end of life).
- An instrument slowly failing.
- The control itself is deteriorating.
Pattern 2: Sporadic Outlier
This pattern is a single, sudden out-of-range event. A significant malfunction of some sort has happened, which usually requires repeating the test. Notice how this pattern differs visually from the gradual drift pattern as shown in Figure 6.
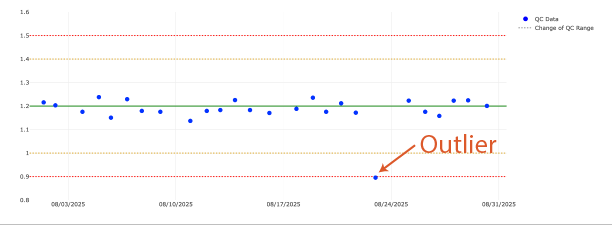
Figure 7. SPC Error – Sporadic Outlier Pattern
Possible Causes:
- Failure to properly dispense onto the slide.
- Pump malfunction.
- Heater failure.
- Drying of the reagent on the slide.
Pattern 3: Shifts
This pattern shows a significant shift in QC levels to a new stable level. See Figure 8 below.
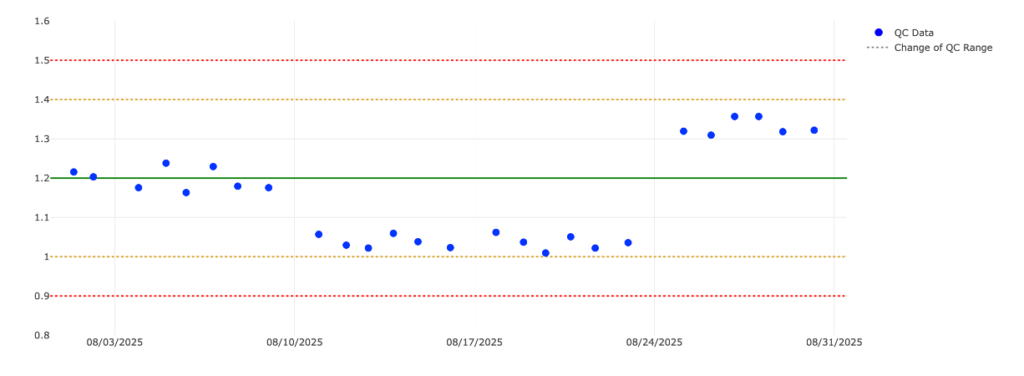
Figure 8. SPC Error – Shifts
Possible Causes:
- Reagent lot change
- Instrument maintenance