BCS Enters Final Phase of FDA MDDT Program to Qualify First-in-Industry Platform to Standardize Cancer Diagnostic Assays

    Contact Us
  • About Us
  • IHC Challenges
  • Products
    • BCS Quality Platform For IHC
    • IHCalibrators® Product Menu
    • IHControls® Product Menu
  • Custom Solutions
  • News
  • Learning Center
    • Overview
    • Metric Calibration and SPC Tutorials
    • IHC: Past – Present – Future
Boston Cell Standards
Contact Us
  • About Us
  • IHC Challenges
  • Products
    • BCS Quality Platform For IHC
    • IHCalibrators® Product Menu
    • IHControls® Product Menu
  • Custom Solutions
  • News
  • Learning Center
    • Overview
    • Metric Calibration and SPC Tutorials
    • IHC: Past – Present – Future

Metric Calibration Tutorial

11
  • Overview
  • Module 1. Introduction
  • Module 2. What are IHCalibrators®?
  • Module 3. Metric Calibration Workflow Steps
  • Module 4. Understanding Metric Calibration Report
  • Module 5. Selecting an IHControl for Statistical Process Control (SPC)
  • Module 6. Understanding Lower Limit Of Detection (LOD)
  • Module 7. Compare LOD With Peer Labs
  • Module 8. Why Does LOD Affect Tissue Staining?
  • Module 9. Avoid Strong Positive Tissue Controls
  • Module 10. Summary: Understanding Metric Calibration

Metric SPC Tutorial

7
  • Overview
  • Module 1. Introduction
  • Module 2. What are IHControls®?
  • Module 3. Metric SPC Workflow Steps
  • Module 4. Understanding the Metric SPC Report
  • Module 5. Interpreting the Metric Levey-Jennings Graph
  • Module 6. Summary: Understanding Metric SPC
View Categories
  • Home
  • Learning Center
  • Metric Calibration Tutorial
  • Module 8. Why Does LOD Affect Tissue Staining?

Module 8. Why Does LOD Affect Tissue Staining?

< 1 min read

Why does LOD affect tissue staining? The simple waterline model shown in Figure 10 below shows how assay analytic sensitivity determines whether a biomarker remains hidden, faintly visible, or fully revealed.

  • The analytic sensitivity is like the water level.
  • The underwater volcano is like the biomarker.
  • An insensitive assay (A, on left) has a high LOD and is represented with a high-water level (LOD), rendering the volcano (biomarker) not visible.
  • A sensitive assay (C, on the right) has a low LOD and is represented with a low-water level (LOD), exposing nearly the entire volcanic island (biomarker), analogous to strong staining.
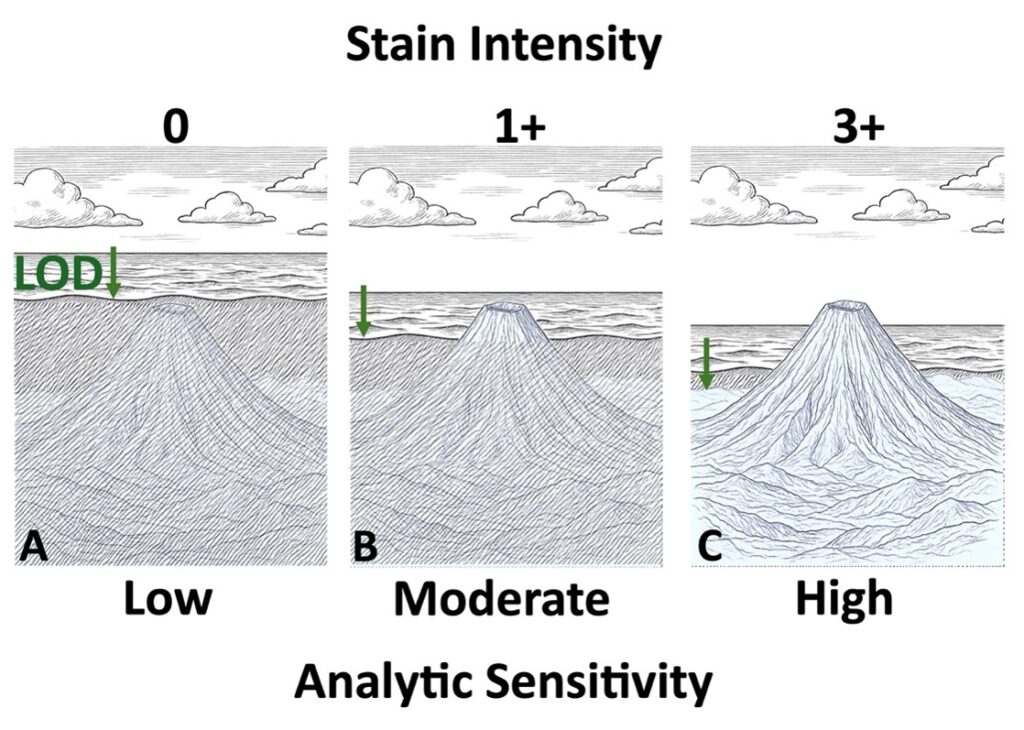
Figure 10. Relationship Between LOD And Stain Intensity

Updated on September 1, 2026
Assay Biomarker LOD Lower Limit of Detection Statistical process Control
Module 7. Compare LOD With Peer LabsModule 9. Avoid Strong Positive Tissue Controls
Boston Cell Standards

Delivering Calibration and Statistical Process Control to make IHC lab testing more accurate

Follow Us
About Us Overview BCS History Leadership Advisors
IHC Challenges Overview
Products Platform Overview IHCalibrators® Product Menu IHControls® Product Menu
News Press Releases
Learning Center
Custom Solutions

© 2026 Boston Cell Standards. FCOI Policy