Selecting an IHControl for SPC
The Metric Calibration Report calculates and illustrates key parameters of your assay. These key parameters are defined below in Table 1 and shown below in Figure 5.
Assay Parameters
| Terms | Definition | What is the significance? |
| Analytic Response Curve A in Figure 5 |
Graphical representation of the relationship of stain intensity (y axis) as a function of biomarker concentration (x axis) | The analytic response curve is required for calculating critical assay parameters such as LOD. |
| Analytic Sensitivity | An assay’s ability to detect or measure a biomarker in a tissue sample. | Analytic sensitivity, quantified by LOD, is an important determinant of staining differences and test errors across IHC labs. |
| Lower Limit of Detection (LOD) B in Figure 5 |
The minimum biomarker concentration that can be reliably distinguished from background under the microscope. | LOD quantifies the assay’s analytic sensitivity. |
| Dynamic Range C in Figure 5 |
The biomarker concentration interval spanning the range of the LOD to the analytic response curve plateau. | Assays with broader dynamic ranges better represent the heterogeneity of biomarker expression. Pathology scoring systems (e.g., H score) better represent the range of protein expression with a broad dynamic range. |
| Table 1. IHC Assay Parameters | ||
You use the Metric-generated analytical response curve to select an IHC control that will be used for Statistical Process Control (SPC). As shown in Figure 5 below, the assay dynamic range is the biomarker concentration interval spanning the range from the LOD to the analytic response curve plateau. You should select a calibrator level that is in the middle of the dynamic range as your assay control for optimal SPC processing results. An example of what not to do is denoted in the graph with the red “x”. Strongly positive samples are terrible controls, very insensitive.
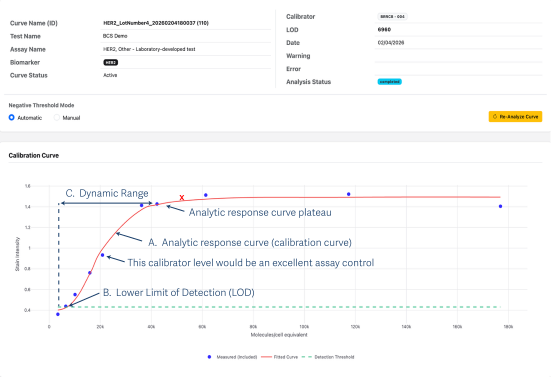
Figure 5. Selecting the optimal control level to use as a control for SPC.